
Google Analytics for Arts Organizations
Google Analytics has become the standard application for analysing web traffic, but it imposes a steep learning curve on those engaging with it for the first time! It’s a powerful tool that tracks far more data than many organizations have use for, or time to deal with. However, if you know where to look, Analytics can be used to make data-driven decisions for your organization.
After the somewhat traumatic experience of wading into Analytics and installing their tracking code onto Orchestras Canada’s website, I decided it was time to broaden my knowledge by completing a Google Analytics for Beginners course. This free course takes around 4-6 hours to complete at your leisure, and is structured as a series of videos, web pages and interactive activities. It is also available in 14 languages, and can be found here.
One of the most striking aspects of this course was the layers of jargon that peppered the presenters’ speech, making much of what they had to say difficult to understand without prior knowledge. Here is some of the basic vocabulary that can help in getting your head around the language used in Analytics.
Google Jargon – English Dictionary
 Users: Visitors to your website.
Reports: Tables and graphs that show data on how users are coming to your website, what they’re doing there and where they leave from. These are broken down into Real-Time, Audience, Acquisition, Behaviour, and Conversion reports.
Bounce Rate: How often your users leave your website directly from the page they land on.
Dimension: A piece of data about your users. These are presented in the first column of your reports, and could be information such as location of user, age of user, method by which they came to your site. This is the data you are measuring.
Metric: The how much of whatever dimension you have selected. Metrics are numbers, presented in the interior columns of your Reports, showing you information such as number of new or returning users, number of browsing sessions or number of pages viewed.
Medium: Tells you how people found your web page. These are very general in nature, and include organic (for free search engines), cpc = cost per click (for advertisements on a search results page), or referral (for links from another website).
Source: This goes into more detail on how people found your web page. For example, if the medium was ‘organic’, the source could be Google or Bing. If the medium was referral, the source would be the address of the website the user found you from (such as Facebook, or the Orchestras Canada website).
What can I do with all this data?
 Find out who your current audience is:
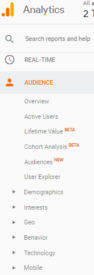 Find out who your current audience is:
Under Audience reports you can find a myriad of data about the people who visit your website. The ‘Overview’ will tell you general information about how many users visit your site, and how many pages they navigate to while they’re there. ‘Geo’ reports tell you the country, city and browser language of your users. If you enable Demographic and Interest Reports, then you can also find out information about your users’ age, gender, and their interests (outside of attending every concert and event that you run, of course).
See how they’re finding you:
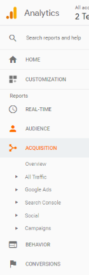 See how they’re finding you:
Under Acquisition reports, you can find out where your users were directly before arriving on your website. Through analysing the ‘All Traffic’ report, you can see the source and medium (source et support), describing where your users came from. Knowing which other sites are generating traffic towards yours can be useful in making marketing decisions when the budget is tight.
Find out where they’re spending their time:
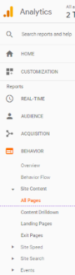 Find out where they’re spending their time:
The Behaviour reports show which areas of your website are performing the best, by showing you how many page views each page has, how many users visit each page, and how often the page bounced (was the only page your user visited in their session). Through the ‘Content Drilldown’, you can also see which sections of your website are performing well.
Gain insight as to why they might be leaving:
Bounce rate is the most useful metric when it comes to evaluating the slightly more complex question of why your users are leaving your website. This number tells you how often users land on your site, take no action and leave. This could mean a number of things; perhaps the link leading to your site didn’t accurately describe what was coming up, perhaps the content wasn’t engaging, or perhaps your user found exactly what they were looking for and moved on. Most times, you want to avoid a high bounce rate and keep people on your website. This information can be found in Behaviour reports, under ‘Site Content’.
In some arts organizations this kind of data collection and analysis can be something that is put into the ‘too hard’ pile. We tend to spend more energy on the transactional data we’ve collected from subscribers, donors and single ticket buyers. Website analytics, however, can provide powerful insights into these people, as well as the people who have not yet been converted to the cause. Analytics can also help us identify bottlenecks on our websites that might be discouraging conversion. Attracting new audiences and ensuring a smooth web journey to these groups is an important part of growing a loyal fan base. The more you know about visitors to your website, the easier it is to let them know what your organization can do for them.